
Digital diagrams are interactive visual representations that support curriculum by converting abstract concepts into structured, learnable formats students can actively engage with. Tools like concept maps, mind maps, and interactive whiteboards give educators a direct way to improve recall, transfer, and student engagement. Research from 2026 confirms that how digital diagrams support curriculum goes well beyond decoration. The evidence points to specific diagram types, design choices, and instructional strategies that produce measurable gains in learning outcomes across STEM and non-STEM subjects alike.
How digital diagrams support curriculum: what the research shows
The case for digital diagrams in education is grounded in cognitive science, not preference. Drawing during study outperforms standard study methods on recall and especially transfer tasks across STEM fields. Transfer, the ability to apply knowledge to new problems, is the hardest learning outcome to achieve. The fact that diagram-based activities produce the largest gains there makes them a priority for curriculum developers.
“Digital diagramming is a form of generative learning that makes thinking visible, helping learners discover gaps and promoting better transfer rather than mere memorization.”
Concept map creation produces even stronger results than passive diagram study. A meta-analysis found an effect size of g=0.72 for creating concept maps versus g=0.43 for simply studying them. That gap is significant. It means students who build their own diagrams learn more deeply than students who read pre-made ones, regardless of subject area.
Multiple visual formats compound these benefits. An experimental platform using zoomable interactive mind maps improved comprehension and mental model construction compared to digital textbooks alone. Mental models are the internal frameworks students use to organize and apply knowledge. Stronger mental models mean students can handle more complex problems with less confusion.

The multimedia learning principle explains why diagrams work at a neurological level. When students process information through both verbal and visual channels simultaneously, they build richer, more connected memories. Digital diagrams activate both channels at once. That dual-channel processing is why a well-designed concept map outperforms a paragraph of text covering the same material.
Drawing activities also improve spatial organization and monitoring accuracy in domain-specific contexts. Two studies with nursing students showed visuospatial test improvements from drawing exercises, even when recall of nonpictorial information did not change significantly. This tells curriculum developers something precise: diagram tasks target specific learning dimensions, and matching the diagram type to the learning goal matters enormously.
Which diagram types produce the best learning outcomes?
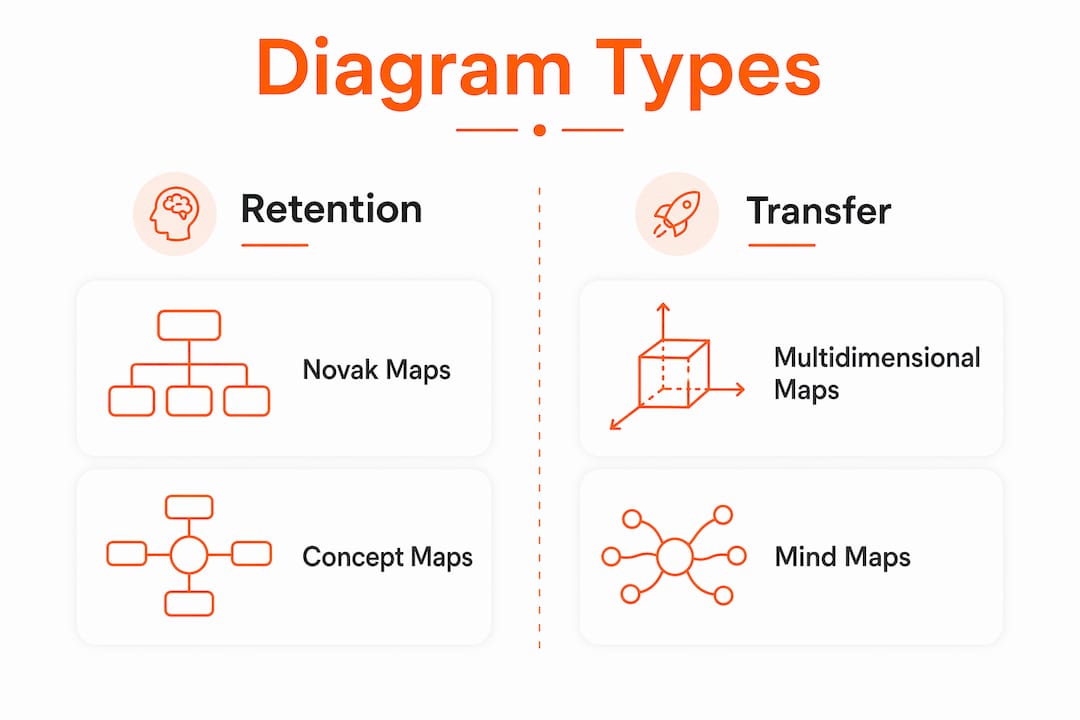
Not all diagrams work the same way, and choosing the wrong type for a given learning goal can undermine results. A 2026 Springer study found that multidimensional concept maps improve transfer scores, while Novak-style concept maps better support retention. That distinction is worth building into your curriculum design process from the start.
| Diagram Type | Best For | Key Consideration |
|---|---|---|
| Novak Concept Maps | Retention of factual relationships | Hierarchical structure supports memorization |
| Multidimensional Maps | Transfer and application tasks | Greater complexity requires careful scaffolding |
| Mind Maps | Hierarchical concept visualization | Works well for brainstorming and topic overviews |
| Drawing Exercises | Visuospatial learning and monitoring | Most effective in anatomy, biology, and spatial subjects |
| Interactive Mind Maps | Mental model construction | Zoomable formats improve comprehension over static text |
Cognitive prompts, the instructional cues that guide how students interact with a diagram, add another layer of complexity. The same 2026 research found that prompts can improve or hinder learning depending on the map type. For multidimensional maps, prompts that push students toward elaboration support transfer. For Novak maps focused on retention, over-prompting can fragment attention and reduce performance.
The practical implication is that a one-size-fits-all diagram template will not serve every learning objective. Curriculum developers need to test diagram structures and prompts against specific goals before deploying them at scale. Iterative design is not optional here. It is the method that separates effective visual curriculum from visually busy curriculum.
Pro Tip: When designing concept map activities, decide first whether your goal is retention or transfer. Then select the map type and prompts accordingly. Mixing both goals in one diagram often dilutes the benefit of each.
Mind maps work particularly well for introducing new units or helping students organize prior knowledge before a lesson. Their hierarchical, branching structure makes relationships between ideas visible at a glance. For deeper conceptual work, multidimensional maps that require students to draw connections across categories produce stronger transfer outcomes.
Does cognitive load affect how well diagrams work?
Cognitive load theory is the most important framework for understanding when digital diagrams help and when they hurt. The theory holds that working memory has a fixed capacity. Diagrams that exceed that capacity add confusion rather than clarity.
Meaningful visuals improve learning. Increasing visual load with relevant images during narrated lessons improves outcomes, while irrelevant or excessive visuals reduce recall, particularly for learners with lower language proficiency or attention challenges. The implication is direct: every visual element in a diagram must carry instructional weight. Decorative graphics, redundant labels, and cluttered layouts consume working memory without contributing to learning.
Spatial integration of diagram cues is one of the most effective design strategies available. Integrated visual signaling in complex software tutorials reduces extraneous cognitive load and improves both retention and transfer. Spatially integrated means placing callouts, labels, and cues directly adjacent to the relevant action or concept, rather than in a separate legend or footnote. This design choice reduces the mental effort required to connect a cue to its referent.
Consider these principles when designing diagrams for your curriculum:
- Limit elements per diagram. Each diagram should communicate one core idea or relationship. Split complex topics across multiple connected diagrams rather than crowding one canvas.
- Align cues with actions. Place labels and callouts directly next to the relevant concept or step, not in a separate key.
- Account for learner differences. Students with lower language proficiency or attention challenges benefit from simpler diagrams with fewer simultaneous elements.
- Avoid redundancy. If a label repeats what a visual already shows clearly, remove the label. Redundant information splits attention without adding meaning.
- Test with real learners. Cognitive load effects are not always predictable from design alone. Pilot your diagrams with a small student group before full deployment.
Pro Tip: Use Onlinewhiteboard’s canvas to build a draft diagram, then ask a colleague or student to narrate what they see without your explanation. If they miss the core idea, the diagram needs simplification before it reaches your class.
How to use digital diagrams effectively across different subjects
Practical implementation is where research meets the classroom. The following steps give educators a structured approach to integrating digital diagrams into any curriculum context.
- Define the learning dimension first. Decide whether your goal is spatial understanding, conceptual retention, or transfer to new problems. This choice determines which diagram type to use before you open any tool.
- Match the diagram to the objective. Use drawing exercises and spatial maps for anatomy, biology, and engineering. Use Novak concept maps for factual retention in history or chemistry. Use multidimensional maps for problem-solving units in math or social sciences.
- Have students build the diagrams themselves. Student-generated diagrams produce stronger outcomes than pre-made ones. Assign diagram creation as a retrieval practice activity rather than providing completed visuals for passive review.
- Use platforms built for real-time collaboration. Onlinewhiteboard gives educators and students a shared digital canvas for building concept maps, mind maps, and visual curriculum plans together. Its real-time collaboration features make it practical for both in-person and remote learning environments. You can explore collaborative whiteboard options to find the setup that fits your classroom workflow.
- Embed diagrams at decision points. Place visual aids at the moments in a lesson where students must make a choice or apply a concept. Spatially integrated cues at action points reduce extraneous load and improve learning efficiency.
- Use diagrams for curriculum planning, not just student activities. Visual mapping of curriculum objectives and assessments in interactive diagram formats helps educators identify gaps, clarify logical flow, and reduce their own cognitive load during lesson design.
- Iterate based on outcomes. Track whether students perform better on retention or transfer tasks after diagram activities. Adjust the diagram type, complexity, and prompts based on what the data shows.
Digital tools for curriculum design like Onlinewhiteboard make this iteration practical. You can revise a diagram template in minutes, share it with a team, and redeploy it in the next lesson cycle without rebuilding from scratch.
Key takeaways
Digital diagrams improve curriculum outcomes most when educators match the diagram type to the specific learning goal and design visuals that minimize extraneous cognitive load.
| Point | Details |
|---|---|
| Active construction beats passive review | Students who build concept maps outperform those who study pre-made ones, with effect size g=0.72 versus g=0.43. |
| Diagram type determines learning outcome | Multidimensional maps improve transfer; Novak maps support retention. Choose based on your objective. |
| Cognitive load design is non-negotiable | Irrelevant visuals hurt recall. Every diagram element must carry instructional meaning. |
| Spatial integration of cues reduces mental effort | Placing labels adjacent to relevant concepts lowers extraneous load and improves retention and transfer. |
| Student-generated diagrams drive deeper learning | Assigning diagram creation as retrieval practice produces stronger transfer than providing completed visuals. |
What i’ve learned from watching diagrams succeed and fail in curriculum
The research is clear, but classroom reality adds nuance that studies rarely capture. The most common mistake I see curriculum developers make is treating diagrams as a finishing touch. They design the lesson, then add a concept map at the end as a summary. That approach misses the point entirely. Diagrams work because they force students to organize thinking during learning, not after it.
The second mistake is assuming more visual detail signals better instruction. A cluttered diagram with 30 nodes and color-coded categories looks thorough. Students often find it paralyzing. The most effective diagrams I have encountered are almost uncomfortably simple. They leave just enough blank space that students feel compelled to fill it in mentally.
Cognitive prompts are genuinely tricky. The 2026 research on concept map strategies confirmed what many experienced educators already suspect: a prompt that works beautifully with one map type can actively interfere with another. Testing your prompts before deploying them is not a luxury. It is the difference between a diagram activity that builds understanding and one that builds frustration.
The educators who get the most from digital diagrams treat them as living documents. They revise them between cohorts, adjust complexity based on student performance, and use tools like Onlinewhiteboard to make that iteration fast. The technology is not the strategy. The strategy is deliberate alignment between visual design and learning goals. The technology just makes execution faster and more collaborative.
— A
Build better curriculum with Onlinewhiteboard
Onlinewhiteboard gives educators and curriculum developers a clean, fast digital canvas for creating concept maps, mind maps, and visual lesson plans without any software installation.

Real-time collaboration means your whole team can build and refine diagrams together, whether you are planning a unit, mapping assessment objectives, or running a live class activity. The platform supports the kind of iterative diagram design that research shows produces the best learning outcomes. You can sketch a concept map, share it instantly, and update it based on student feedback in the same session. Start building your visual curriculum today at Onlinewhiteboard for free and see how much clearer your lessons become when the thinking is visible.
FAQ
What is the main benefit of digital diagrams in education?
Digital diagrams improve both retention and transfer of knowledge by activating dual-channel processing and making student thinking visible. Creating concept maps produces an effect size of g=0.72 compared to g=0.43 for passive study.
Which diagram type is best for transfer learning?
Multidimensional concept maps produce stronger transfer scores than Novak-style maps, according to a 2026 Springer study. Novak maps are better suited to retention-focused learning objectives.
How do digital diagrams affect cognitive load?
Meaningful visuals reduce cognitive load, but irrelevant or excessive visuals increase it. Spatially integrated diagram cues placed adjacent to relevant concepts reduce extraneous load and improve learning efficiency.
Should students create their own diagrams or study pre-made ones?
Students should create their own diagrams. Drawing during study outperforms passive review on transfer tasks, and student-generated diagrams function as active retrieval practice that deepens understanding.
Can digital diagrams support curriculum planning for educators?
Yes. Visual mapping of curriculum objectives and assessments in interactive diagram formats helps educators identify gaps, clarify logical flow, and reduce cognitive load during lesson design.